Introducing Benefit Ledger
Amplify's Benefit Ledger is essentially a listing of benefits affecting your enterprise or initiative in a single tabular view. Using this new interface you can view and edit the plan, actual, and forecast values of simple benefits all in one location.
- Easy data entry - click in a cell and start typing.
- Add Actuals or Plan values in bulk. Directly paste a valid range of cells from Excel file into the Ledger.
- Get the bigger picture. See Plan, Actual, and Forecast data grouped by initiatives.
- Take advantage of the filter options - Filter benefits by resolution, unit, series type, or for a duration.
- Organise your data in a logical and orderly manner using column options and filters.
- Save a preferred custom layout for future use.
The access to Benefit Ledger can be restricted by the classification setting Enable Benefit Ledger.
Usability Enhancements in Integrations Feature
We have done a few design touch-ups that will help you find your way around the Integrations feature.
What you'll see differently:
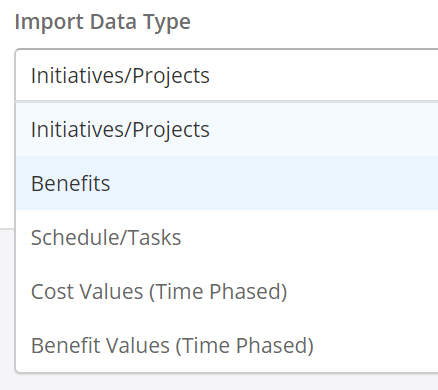
- Modified Import Data Type names
- Icons to identify required fields for the first time mapping or for modifying a mapping. Hover over the icon to see a helpful tool-tip.
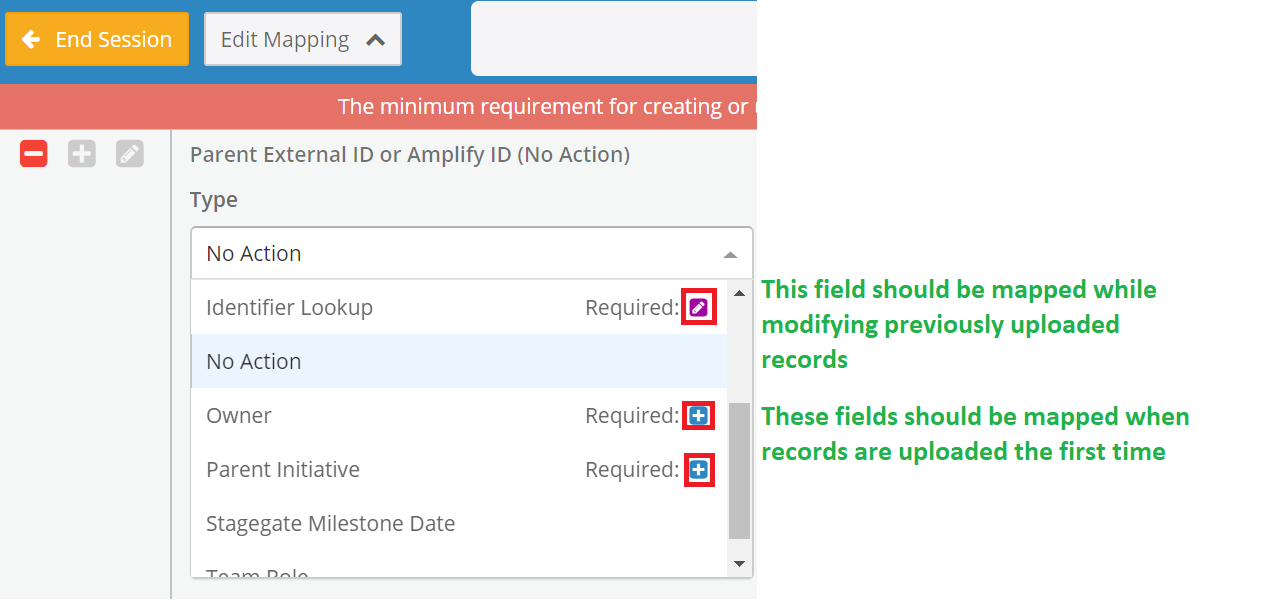
- A message that displays at the top until all mappings are completed correctly.
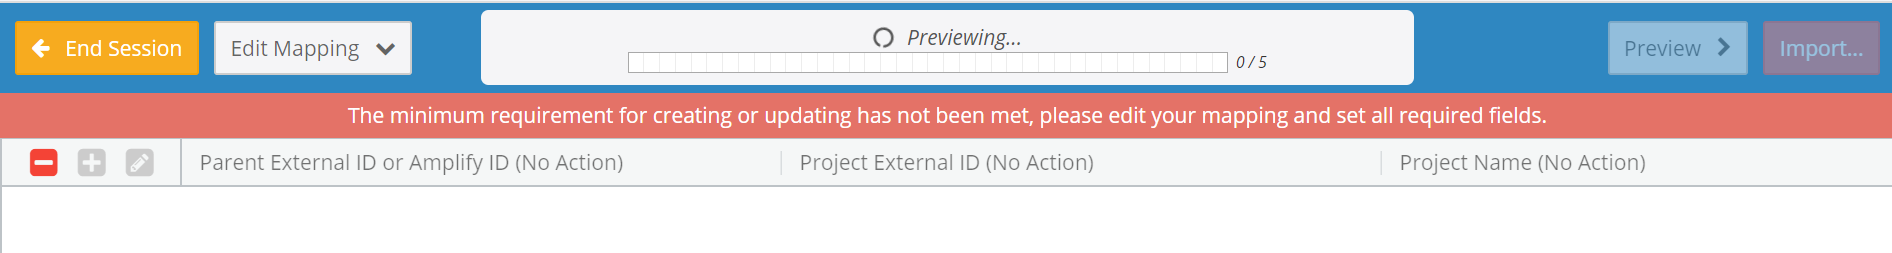
- The preview button is disabled until all mappings are done correctly.
Net Benefit
The Investment Dashboard can show a lot of meaningful plottings in separate views. Benefits, costs, cumulative, non-cumulative- but even in all its greatness, it is missing one significant statistic- the current Net Position. The benefits minus costs on a single view. Previously, Amplify showed costs and benefits in two separate views on the Investment Dashboard. If one had to compare these values, they would require to open two application sessions, one showing Investment Dashboard filtered by costs, and the other by benefits. To work around this, several of our customers have made it a habit to use the benefit classification to represent costs ( defined as disbenefits). The Investment Dashboard can then be filtered by benefits alone to generate a comparison graph between negative benefits(disbenefits) and positive benefits. We are getting rid of this complication with 19.10 version by introducing a quick and easy solution that is available for you take benefit of.
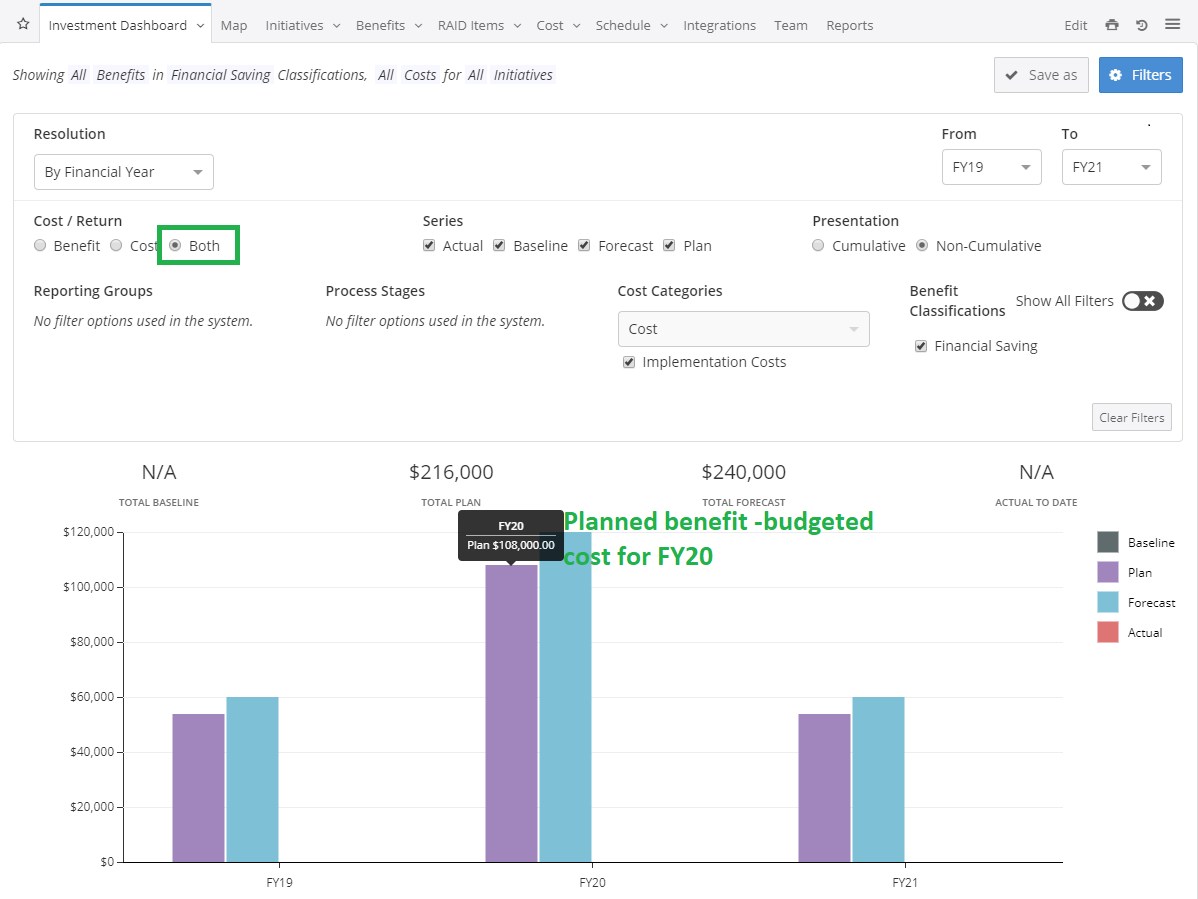
From version 19.10 onwards, you do not require to create disbenefits or switch between cost and benefit filter views to see your net position. A new filter option does the job for you. When you use this option to filter, the graph shows differences between planned benefit and budgeted cost, actual benefits and actual costs, and the projected values per year for the life of the initiative.
To view the net benefit on the Investment Dashboard:
- Click Filters.
- Select the option 'Both'.
- Set other filter options as preferred.
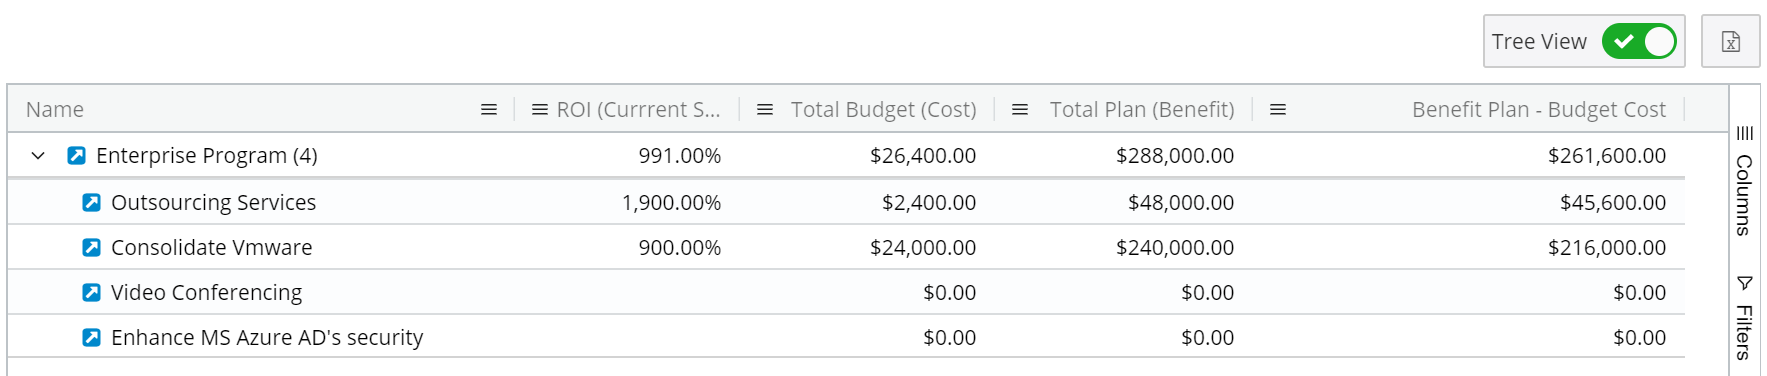
Each rectangular bar represents the difference between benefit and cost value for plan, actual, or forecast series, for different time periods along the Y-axis.
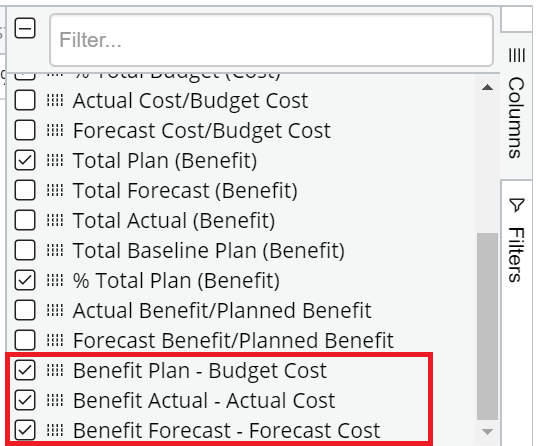
Three new columns, Benefit Plan - Budget Cost, Benefit Actual - Actual Cost and Benefit Forecast - Forecast Cost are included in Columns options to help you create a more meaningful tabular representation of data.
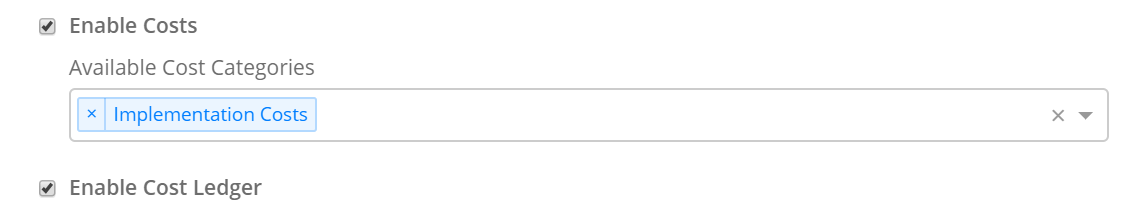
Design Improvements on Cost Ledger
The Cost Ledger feature is perfected with a new configuration setting. Enable Cost Ledger setting offers you the flexibility to provide access to the Cost Ledger without having to enable local costs at that level.
Issues Resolved
| Issue key | Summary |
| AMP- 8453 | While re-submitting a dependency approval request, the names of approvers who previously rejected the request were showing up in the approvers' list once again. This has been fixed and now a rejected workflow's approvers list will be reset to the list of approvers pre-configured for the workflow. |
| AMP- 8458 | If you clicked on a cell in the Cost Ledger and copied a bunch of values from Excel, the data was getting copied several times. Our fix ensures that data is copied only once. A single click on a cell and press Ctrl+V to paste all copied values from MS Excel on to the Ledger interface. |
| AMP-8409 | Some of our users were not able to view the benefits data entry screen as it was indefinitely loading. We found that this is due to the absence of specific permissions on Measures for their role, even if the role had Cascade Permissions enabled. We have resolved this issue in a straightforward way. If a user has access to benefits, then they have automatic access to the measures. |
| AMP- 8124 | Internet Explorer failed to display a custom navigation logo when the file type is different from what is expected by the code. We have fixed this issue. |
| AMP- 8386 | Some reports showed multiple options per parameter, but you could select only a single option that will be passed to SSRS. The fix ensures that you can select multiple options per parameter and all of the selected parameters are passed to SSRS. |